In-store Media Readiness Assessment
Is your store a medium, yet?
Your stores already gather the audience. The question is whether that audience is worth money, and whether the company could sell it if it were. This package answers both in four to six weeks, for a fixed fee, before a single screen is bought.
- Fixed fee
- 4 to 6 weeks
- One venue
- One verdict
Trusted by leading European retailers





What it is
What the assessment does
The In-store Media Readiness Assessment is a fixed-fee package by Pygmalios that measures one venue, models what a campaign in it would reach in likely-to-see impressions, and judges whether the company could sell that space. Four to six weeks, before a single screen is bought.
Your store already gathers an audience. We measure what it is worth, what it reveals, and whether it can be sold. In four to six weeks, for a fixed fee, you get one reach number, an indicative media value at an assumed CPM, a verdict on whether the company is set up to sell the space, and a clearer view of how customers use the venue. It ends in a named first pilot, or in a clear no, which is the cheaper of the two answers.
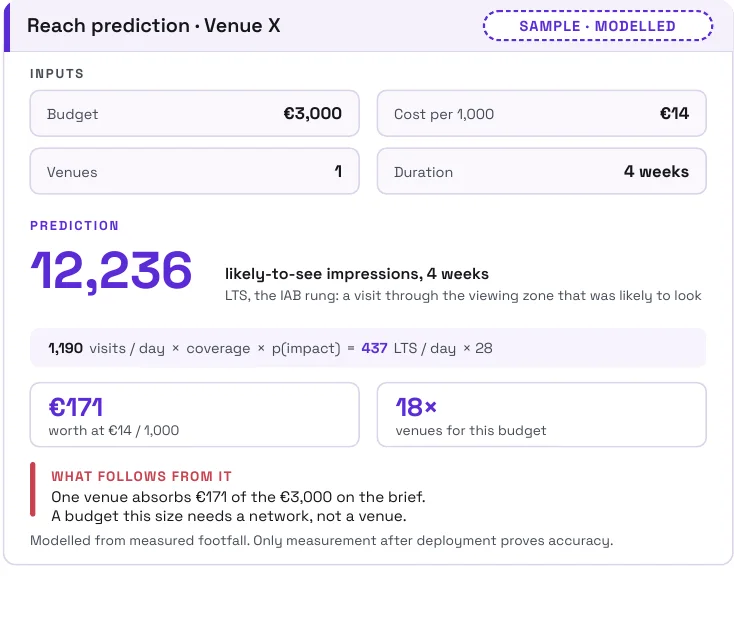
One venue is measured. A brief of network size needs eighteen venues like it, not one.
What it contains
Two modules, one verdict
Module 1: Venue
-
Survey and floorplan
Ceiling and shelf heights, photos of the space, camera angles.
-
Venue model
Footfall distributed in time and in place, from measured data.
-
Screen placement
Where they belong, backed by the model rather than by eye.
-
Ad and zone matching
Which creative belongs on which screen, matched to the category it faces.
-
Reach prediction
How many likely-to-see impressions a campaign gets for a given budget.
-
Verification plan
What is measured after the pilot and how it is compared with the prediction.
Module 2: Organisation
-
Owner and process
Who owns the advertising space today, who sells it, and whether anyone does.
-
Reporting standard
How a campaign in the venue is reported to a brand, and whether it can be at all.
-
Own brands or outside money
Whether the screens carry your own promotions, or space is sold to brands that do not compete with you.
-
Budget source
Whether the money would come from trade marketing or from media, and who signs it.
-
Who runs it day to day
Who schedules the screens, handles the creative and answers the advertiser. The part that quietly decides whether it survives.
-
Network, not a venue
What it takes to join venues into a format a brand can buy with one brief.
How it runs
Five steps, four of them before deployment
- 1
Survey
Floorplan, ceiling and shelf heights, photos. Without them the camera angles cannot be judged.
- 2
Model
From measured footfall we build the distribution of people in time and in place.
- 3
Prediction
The model says where the screens belong and how many likely-to-see impressions a campaign gets for a given budget.
- 4
Workshop
Half a day with your team: who owns the space, who sells it, how it is reported. Ends in the verdict.
- 5
Verification
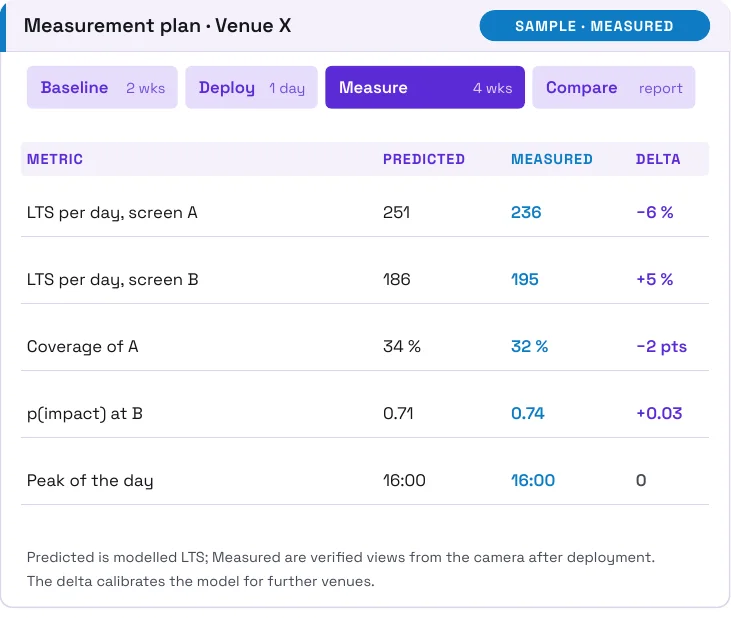
After the pilot the same thing is measured and compared. The model is calibrated by it.
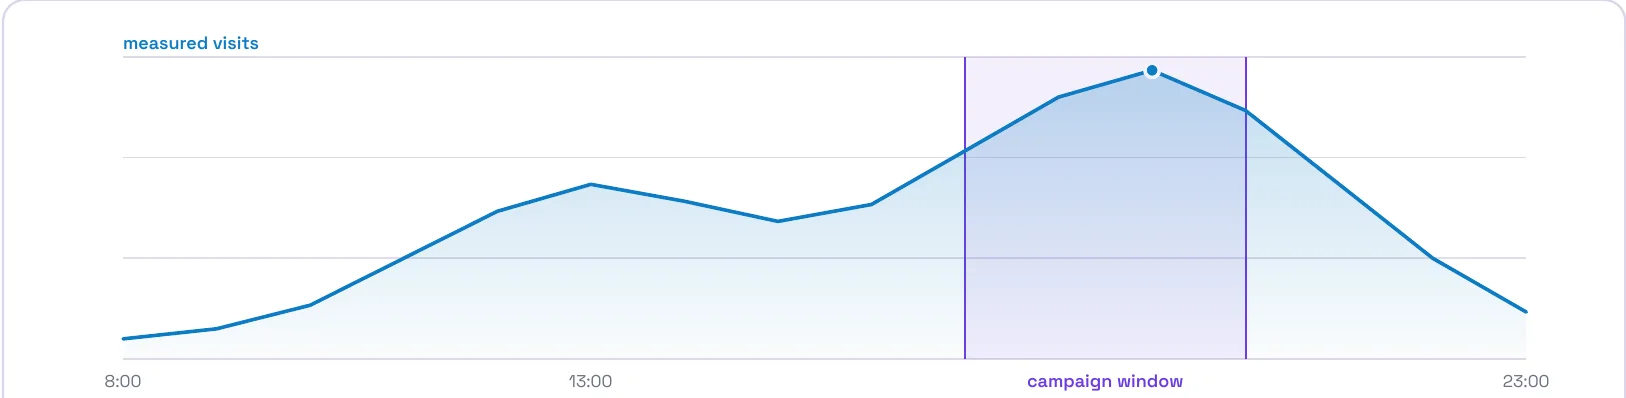
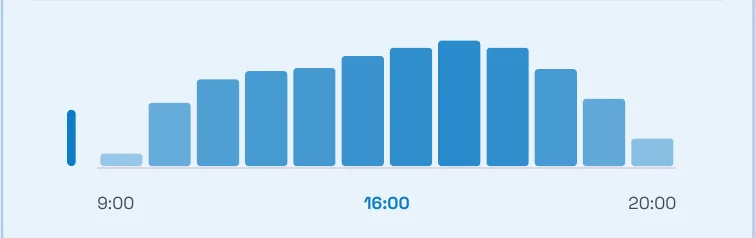
One view out of the model
When your customers are actually in the store
What you get
Four outputs, and the verdict they add up to
What you learn about the space
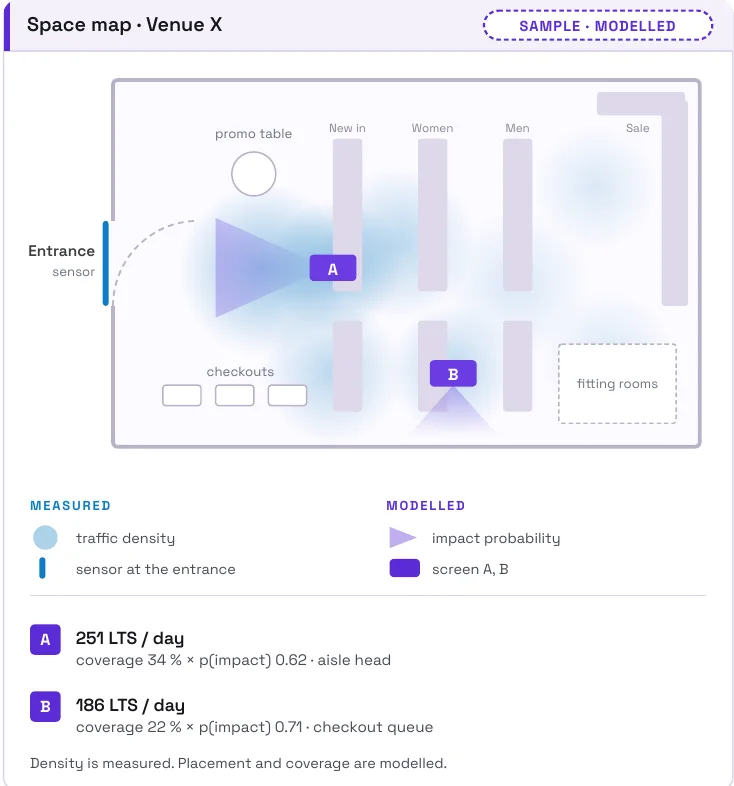
Space map
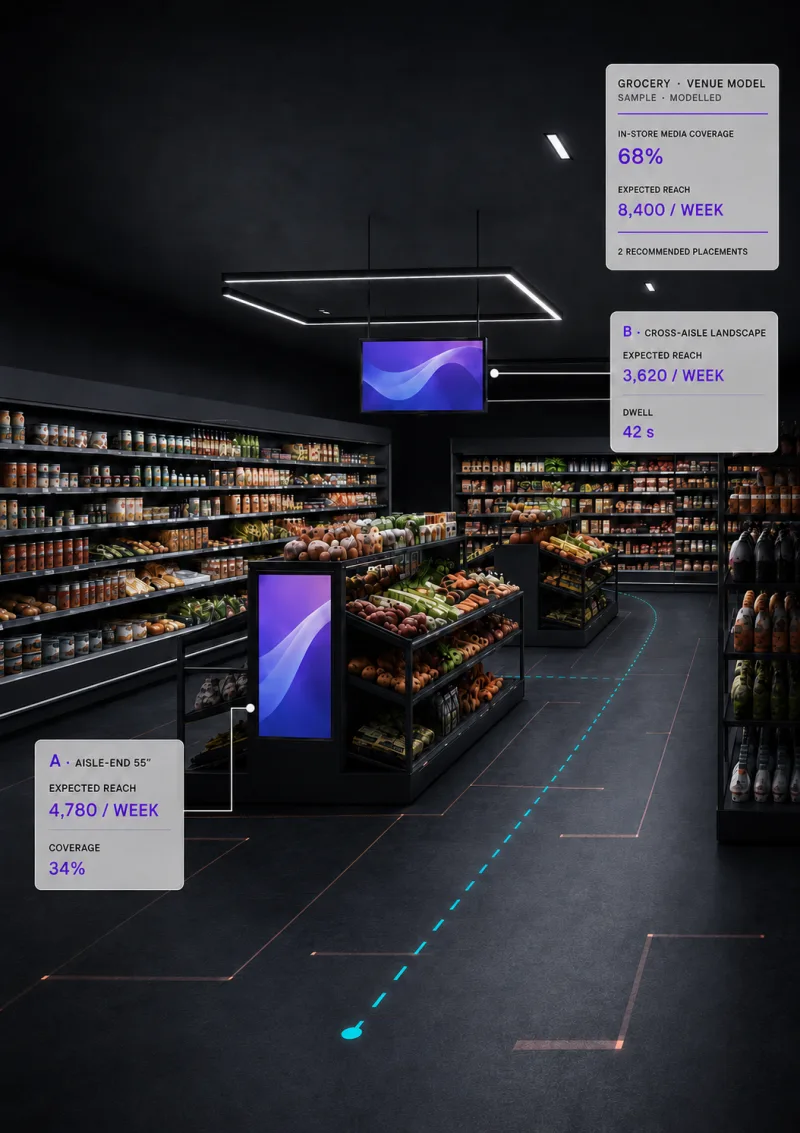
Floorplan with the proposed screen placement and the reason for each position.
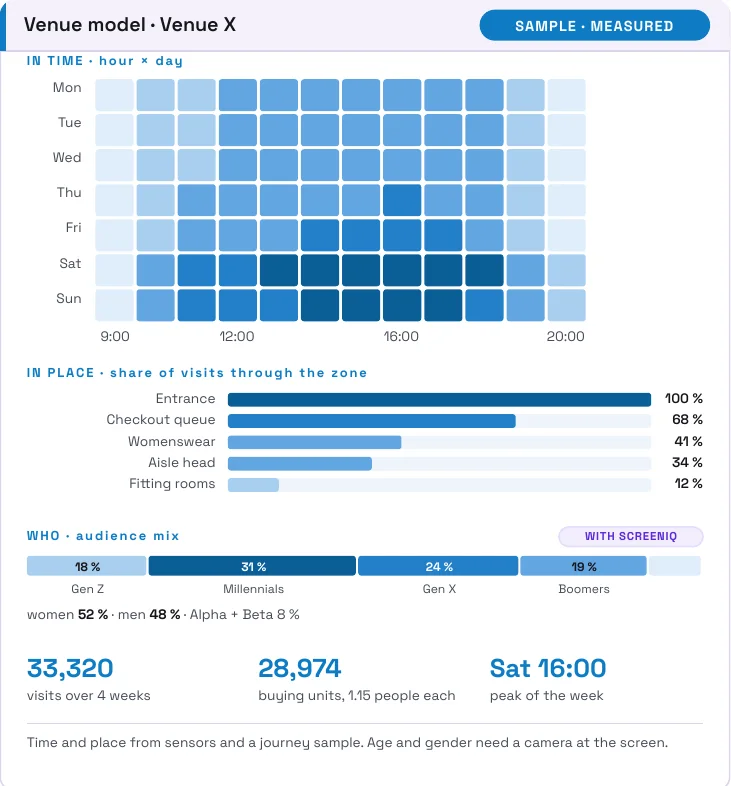
Venue model
Visits distributed in time, in place and by audience, built on measured data, and what that reveals about customer behaviour.
What you do with it
Reach prediction
For a given budget and a known cost per thousand: when, and how many times the campaign is likely to be seen.
Measurement plan
What is measured after deployment and how the result is compared with the prediction.
All five arrive as one report, with the floorplan and the model as files you keep. Nothing in it depends on us to read, and nothing in it is locked to our software.
Every figure is sample data, marked as such in each frame. Real figures come from the survey and the measurement of a particular venue.
What we need from you
What we need from you, and what sharpens the answer
To start
- Floorplan Any format. A hand sketch is enough to start.
- Heights and photos Ceilings, shelves and fixtures, photographed on a phone. They decide what a screen can see.
- Siting rules Where a screen may legally hang: fire regulations, landlord and franchise terms, brand standards.
- Category zones The planogram, or just which category sits where. An ad is matched to the zone it faces.
- Half a day of your team Marketing, operations, and whoever sells anything in the space today.
To narrow the answer
- Footfall data Your own counters, or ours running for a few weeks. This is the single input that moves the answer most.
- Route and dwell Where people slow down and turn. Without it the route is inferred; with it, it is read.
- Context that moves the route EV chargers, coffee, ATMs, click and collect, toilets. Each one bends the path and none of it is on a floorplan.
- Promotions and sales The promo calendar, and POS if you can share it. They separate a campaign effect from a price effect.
The engines behind it
Two tools of ours to help with the measuring
Traffic Analytics
Counts visits at the entrance and distributes them in time. It is what turns a venue into a curve, and the curve into a reach number.
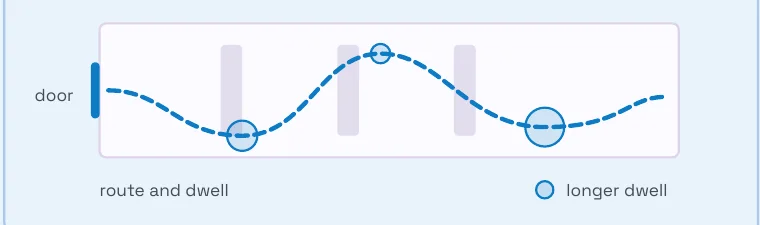
Journey Analytics
Follows the route through the venue: where people slow down, where they turn, how long they stand. It is what makes a screen position defensible rather than guessed.
The assessment itself installs nothing and needs no cameras in the store, which is why it clears reviews a camera project would not. With Traffic Analytics or Journey Analytics running for a few weeks, the same model stops estimating the route and starts reading it, and the reach figure narrows from a range to a number you can put in front of a brand.
Limits
What an assessment does not promise
A prediction before deployment stays a prediction
Accuracy is proven by the comparison after measurement, not by the model. That is why verification is part of the delivery, not an add-on.
Nothing about an individual person
We work with a venue model and a sensor sample, with dwell and orientation. Not with identification of people.
One venue is not sellable inventory
What is sellable is venues joined into a network. An assessment is a step towards that, not a substitute for it.
Who it is for
Four situations where it makes sense
Operators with screens
The hardware is bought and installed, but nobody can say what that space is worth.
Chains considering inventory
The decision whether to go into screens at all comes before the first one is bought.
Brands and agencies
The question of whether in-store budget can be accounted for the way digital is.
Venues already measuring
Footfall data is already running; what is missing is the model that turns it into a media metric.
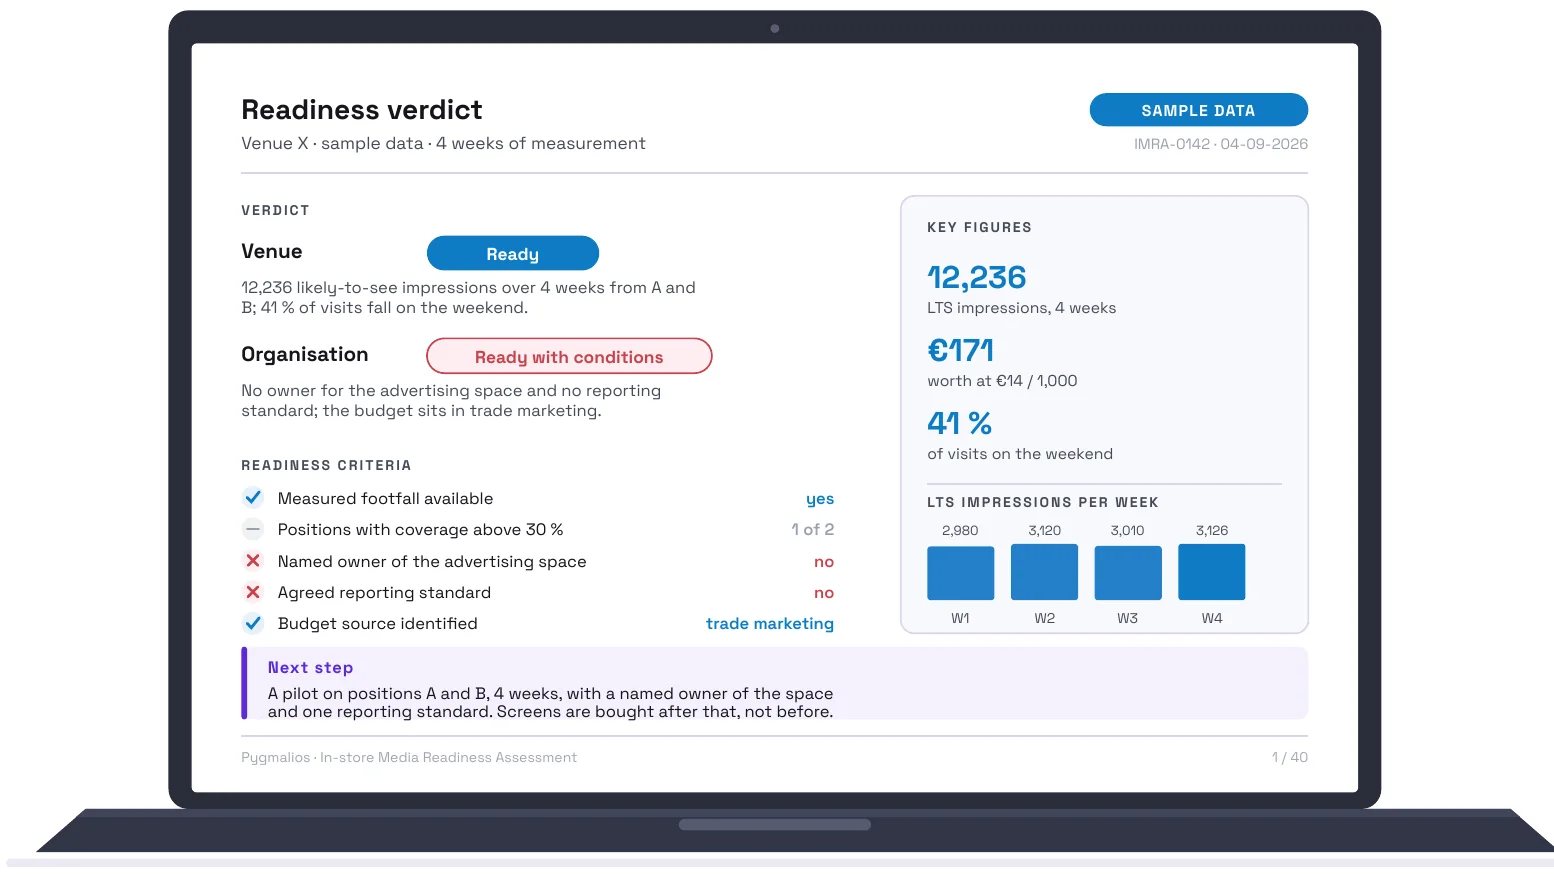
Readiness verdict
Venue and organisation on one page: ready, ready with conditions, or not yet, and the first pilot
Scope and duration
Fixed scope, fixed fee
The package
Readiness Assessment, one venue
4 to 6 weeks
Both modules, all five outputs, half-day workshop with your team. Two of the weeks are the sensor baseline and run without your involvement.
Add-on
Each further venue, same chain
+1 week each
Own space map, model and reach prediction. The organisation module is not repeated, so venue twenty costs a fraction of venue one.
Add-on
Pilot verification
6 weeks
Four weeks of measurement after deployment, compared against the prediction.
The fee is fixed and quoted per venue on request. Not included: screens, their installation, content, and selling the media space.
Page version of 9 September 2026. The visuals are schematics of the mechanism, not measured data from a particular venue.
Next step
The fastest way in is a half-hour call about one venue you are considering
On that call we tell you whether a full assessment is likely to add anything material, for media value and for customer insight. If not, we say so.
Prefer to read first?
The seven-page leaflet: modules, outputs on sample data, limits and what we need from you. One e-mail, one PDF.
Free PDF. One e-mail, the leaflet, done.
Book the assessment call
Questions
Frequently asked
Does the assessment install anything in the store?
No. The assessment itself installs nothing and needs no cameras in the store, which is why it clears reviews a camera project would not. Footfall data from your own counters, or from Traffic Analytics or Journey Analytics running for a few weeks, narrows the reach figure from a range to a number.
How long does it take, and what does it cost?
Four to six weeks for one venue, two of which are the sensor baseline and run without your involvement. The fee is fixed and quoted per venue on request; each further venue in the same chain adds about a week and costs a fraction of the first.
What is a likely-to-see impression?
A visit through the viewing zone of a screen that was likely to look at it: visits times coverage times the probability of impact from dwell and orientation. It is the rung of the IAB impression ladder just below a verified view, which is what ScreenIQ by Pygmalios measures after deployment.
Does it identify individual shoppers?
No. We work with a venue model and a sensor sample, with dwell and orientation. Nothing about an individual person is collected or inferred.
What do we get at the end?
One report with five outputs: space map, venue model, reach prediction, measurement plan and a readiness verdict for the venue and the organisation, with a named first pilot or a clear no. The floorplan and the model are files you keep.
Is one assessed venue something a brand can buy?
Not on its own. What is sellable is venues joined into a network with one brief, one budget and one report. The assessment is a step towards that, not a substitute for it.
About Pygmalios
We have been reading physical space as data since 2015, from Bratislava
Pygmalios builds privacy-first computer vision for retail: how many people came, where they went, how long they stood, who was in front of a screen. Over two thousand locations in twenty countries, and the same engine that produces the numbers in an assessment. We are a product company, not an agency: we do not sell media space and we do not compete for the budget the assessment unlocks.
- Founded
- 2015, Bratislava
- Live
- 2,000+ locations, 20+ countries
- Measured
- 250M+ shopper sessions
- Privacy
- No identification of individuals