AI-Powered Audience Analytics
Know Who's Watching.
Prove What Works.
ScreenIQ tells you who looked at your screen, for how long, and whether the content landed. Runs on-device. No footage leaves the hardware.
Trusted by leading European retailers


Capabilities
What ScreenIQ Measures
All data is anonymous. No images ever leave the device.
Audience Demographics
Age group and gender — per viewer, per session. Age is reported in six generational buckets: Gen Z, Millennials, Gen X, Boomers, Gen Alpha, Gen Beta. No surveys, no apps.
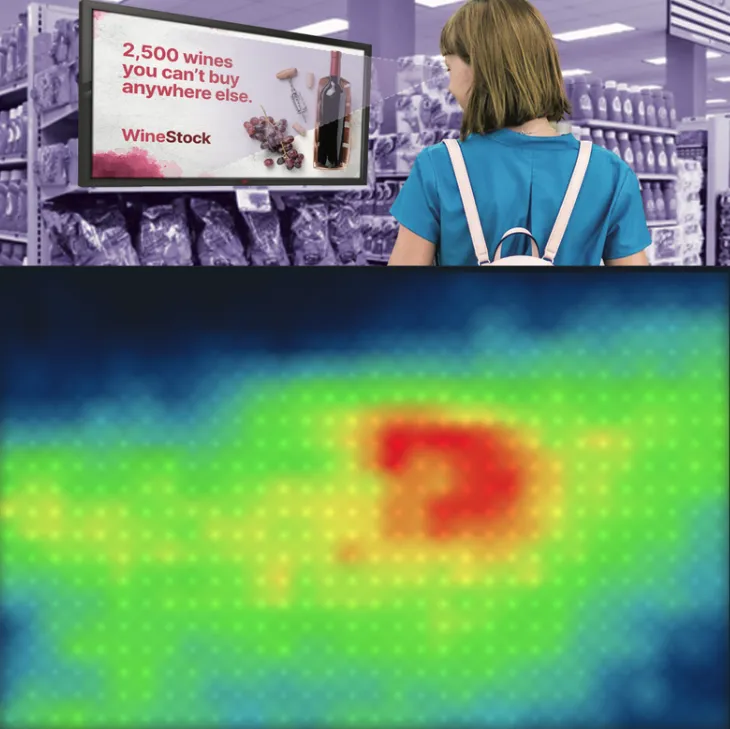
Eye Tracking
Did they actually look at the screen? For how long? ScreenIQ measures gaze, not just presence.
Dwell Time
Down-to-the-second measurement of how long each person stays in front of your display.
Engagement Score
A single 0–100 number. Blends attention, dwell, and reaction so you can compare content at a glance.
Footfall Counting
Counts everyone who passes by, even from behind or at an angle. That gives you true OTS numbers.
Staff Filtering
Employees get filtered out automatically. Your reports show customers, not the guy restocking shelves.
Verified Views
Not everyone who walks past actually saw the ad. A Verified View counts only viewers with face or body confirmed and at least one second of dwell — the number media buyers actually want.
Zone Intelligence
Draw zones on a floorplan. Track traffic, attention, and dwell per zone. Find the dead spots.
Opportunity to See
Were they close enough, facing the right way, long enough to actually see it? That's what OTS answers.
Adaptive Performance
Built-in watchdog monitors system load and gracefully adjusts model complexity to maintain stable frame rates — no manual tuning required.
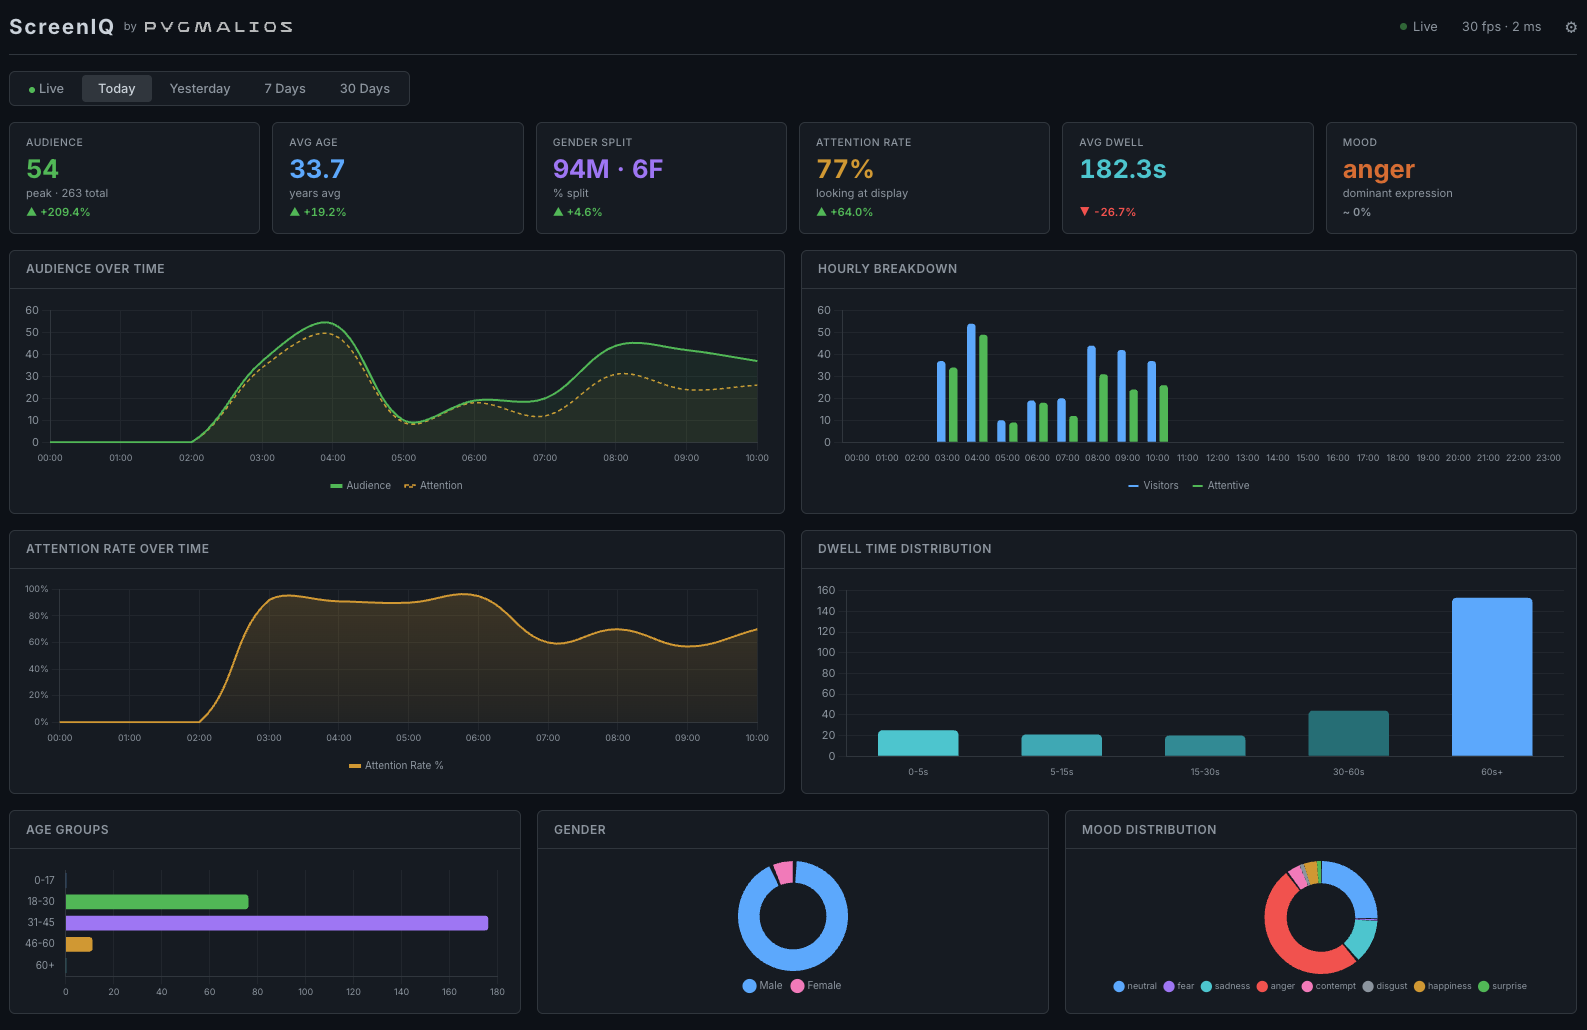
Real-Time Dashboard
Live view, historical charts, and heatmaps. One dashboard per device, with network-level views available via Screenflow.
AI Pipeline
9 Models. Every Frame.
Each frame runs through a stack of 9 specialized vision models — all on-device, all in real time. Here's what fires and in what order.
Face Detection
Locates every face in the frame. Works at angles up to 60° off-axis, under mixed lighting, and at distances from 0.5 m to 8 m.
Face Tracking
Assigns a temporary ID to each face so metrics stay tied to the right person across consecutive frames. ID dies when the viewer leaves.
Demographics
Estimates age bracket and gender from facial geometry. No biometric template is stored — the model outputs a category, not an identity.
Gaze Estimation
Calculates where the viewer is looking relative to the screen surface. This is what separates "walked past" from "actually saw it."
Attention Scoring
Combines gaze direction, head pose, and dwell to produce a per-viewer attention score. Updated every 200 ms.
Sentiment Analysis
Reads facial micro-expressions — smile, surprise, confusion, neutral. Mapped to the content playing at that exact second.
Staff Filtering
Staff are enrolled once via the dashboard — a two-minute process. From that point on, they're matched and removed from all analytics automatically.
Aggregation & Upload
Raw detections are compressed into anonymous statistics — counts, distributions, scores. If cloud relay is configured, only these numbers are transmitted. Nothing else leaves the device.
⚡ 9 specialized models process each frame on a single edge device. No cloud dependency, no bandwidth hit — up to 15 fps on Intel edge hardware.
Unlike cloud-dependent solutions, ScreenIQ runs everything on the device itself — no recurring cloud costs, no data transfers, no consent barriers for standard analytics. Your data never leaves your premises.
Dashboard
Live Data, Per Device
Real-time counts, demographic splits, historical trends, and attention heatmaps. One dashboard per device. Network-level views and cross-location reporting available via Screenflow.
Product Tiers
Pick the Depth You Need
Every tier runs the same edge hardware. The difference is which models are active and what data you get back.
Basic
- ✓ Footfall counting
- ✓ Opportunity to See (OTS)
- ✓ Basic demographics
- ✓ Hourly traffic reports
Standard
- ✓ Everything in Basic
- ✓ Gaze tracking & attention score
- ✓ Dwell time per visitor
- ✓ Engagement score
- ✓ Staff filtering
- ✓ Zone intelligence
Premium
- ✓ Everything in Standard
- ✓ Multi-device management
- ✓ Custom data retention
- ✓ Network reporting via Screenflow
- ✓ Priority onboarding
- ✓ Dedicated support SLA
No hardware purchase required
We supply the edge device as part of the subscription. You provide power and a USB or IP camera — that's it. No capital expense, no procurement cycle.
Billing Models
Pay for What You Measure
Cost per Player
Flat monthly fee per screen. Predictable costs regardless of traffic volume. Best for networks with stable screen counts.
Cost per Mille
Priced per thousand verified impressions. Aligns your analytics cost directly with audience delivery. Ideal for ad-funded screens.
Cost per Viewer
Charged per unique viewer session with attention confirmed. You only pay when someone actually looks. Built for performance-driven campaigns.
Who Uses ScreenIQ
Your Screens Already Have an Audience. Now Prove It.
Retailers, DOOH operators, and brands use ScreenIQ to stop guessing and start measuring what their screens actually deliver.
Retail Media Networks
You have screens in stores. Advertisers want proof that people saw their ad. ScreenIQ gives you CPM-grade metrics: verified impressions, demographics, attention duration. The same data they get from programmatic, except this is physical.
Turn existing screens into sellable mediaDOOH Operators
Mall, transit, QSR, public venue. Doesn't matter. You get standardized impression and attention data across all of them. Price your inventory on who actually saw it, not how many people walked past the building.
Back your rate card with real numbersBrand & Shopper Marketing
Spending on in-store screens with no real reporting? ScreenIQ shows exactly which creative worked, for which audience, at which location. Run A/B tests via your signage player and use ScreenIQ data to prove which one performed — by age group, daypart, or store.
Replace gut feel with measured performanceRetail Operations & CX
Zone-level traffic data, peak hours by area, dwell time by display. Use it to rethink screen placement, adjust staffing, or figure out why aisle 7 gets zero attention after 4pm.
Decisions backed by store-level dataConnects with your existing stack
Metric Definitions
What the Numbers Mean
Every metric has a clear definition and a documented methodology. No black boxes.
OTS (Opportunity to See)
A person was within viewing range, facing the screen, for at least 1 second.
distance ≤ 8m AND head_angle ≤ 60° AND dwell ≥ 1s Verified View
Face or body confirmed, with dwell ≥ 1 second. Proof someone actually watched.
face_or_body_confirmed = true AND dwell ≥ 1s Dwell Time
Total time a viewer spent within the detection zone, regardless of gaze direction.
exit_timestamp − entry_timestamp (seconds) Attention Time
Subset of dwell time where gaze was confirmed on-screen. Always ≤ dwell time.
Σ(gaze_on_screen intervals) within dwell period Engagement Score
Composite 0–100 index combining dwell time and attention ratio.
0.4 × dwell_norm + 0.6 × attention_ratio Audience Composition
Percentage breakdown of viewers by age bracket and gender for a given time window.
count_per_segment ÷ total_viewers × 100 GDPR Compliance
Compliant out of the box.
Standard analytics run under GDPR Art. 6(1)(f) legitimate interest. No DPIA. No consent collection. No legal groundwork before you start.
No consent required
Standard analytics qualify under legitimate interest. Visitors don't need to opt in.
Data never leaves the device
Video analyzed on-device. No footage or face data transmitted. Ever.
Children auto-protected
Sensitive attributes suppressed for under-16s — regardless of configuration.
Analytics presets
| Preset | Re-ID | Expr. | Gaze | Notes |
|---|---|---|---|---|
| Strict | — | — | — | Minimum data, no consent required |
| Standard | — | — | ✓ | Balanced analytics, no consent required |
| Extended | ✓ | ✓ | ✓ | Full features, consent recommended |
Art. 6(1)(f) legitimate interest covers standard analytics. No consent mechanism required for typical retail deployments.
How It Works
Edge AI. Nothing Leaves the Box.
A small device sits behind the screen. It runs all the vision models locally. No video streaming, no cloud dependency, no bandwidth hit.
Works offline
no internet needed for analytics
Plug and play
< 1 hour from unbox to live data
OTA model updates
new capabilities ship remotely
Any scale
one screen or ten thousand
Camera-agnostic
USB, IP, whatever you have
Always on
self-recovers under load
Good to know: Runs on Intel 8th Gen+ edge hardware — N100, N200, or N305. 8 GB RAM, 32 GB storage, USB or IP camera. We help you spec the right device.
Proven in production
“Long-term observations through Pygmalios Analytics can provide us with a comprehensive picture of the best-selling product groups, and we can also visually detect changes in buying behavior based on external incentives.”

Lubomír Franta
CIO, DM Drogerie Markt
From Our Knowledge Hub
Recommended Reading
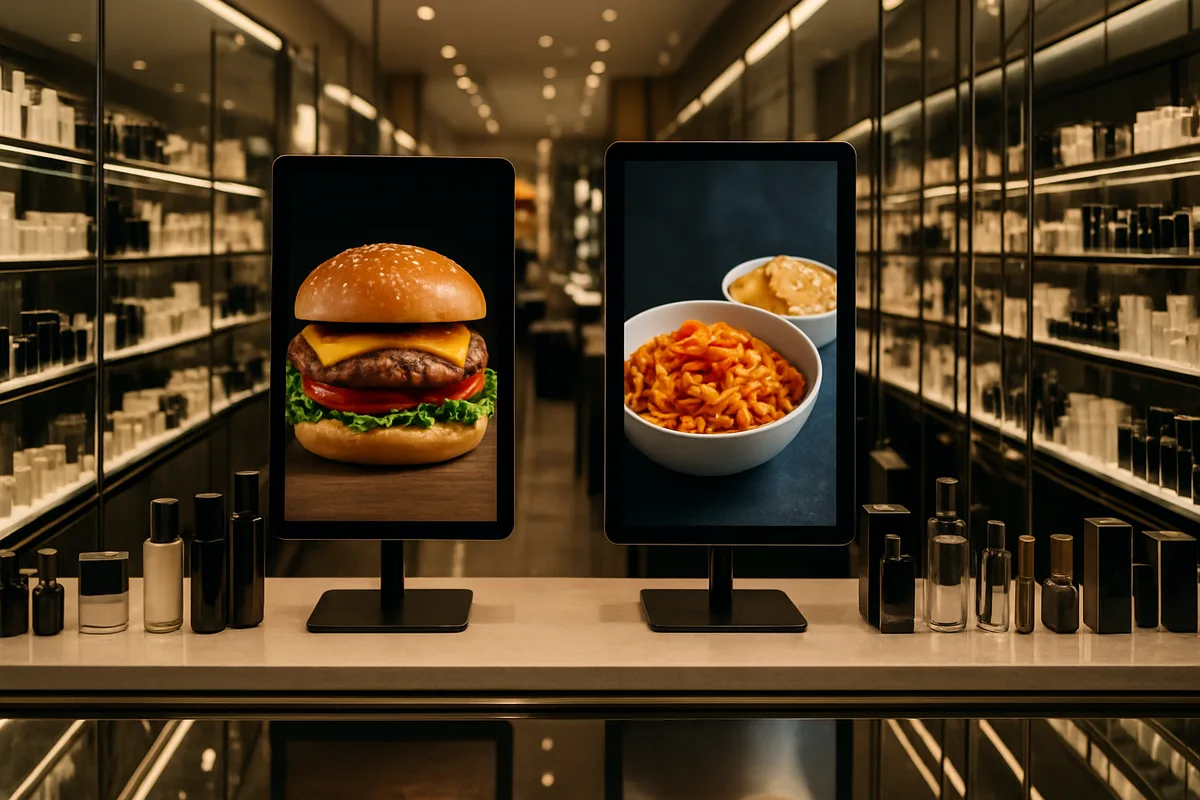
Best Digital Signage Solutions for Food Retail
Discover the best digital signage solutions for food retail. From dynamic pricing to drive-thru screens — proven strategies that boost ROI.
Read article →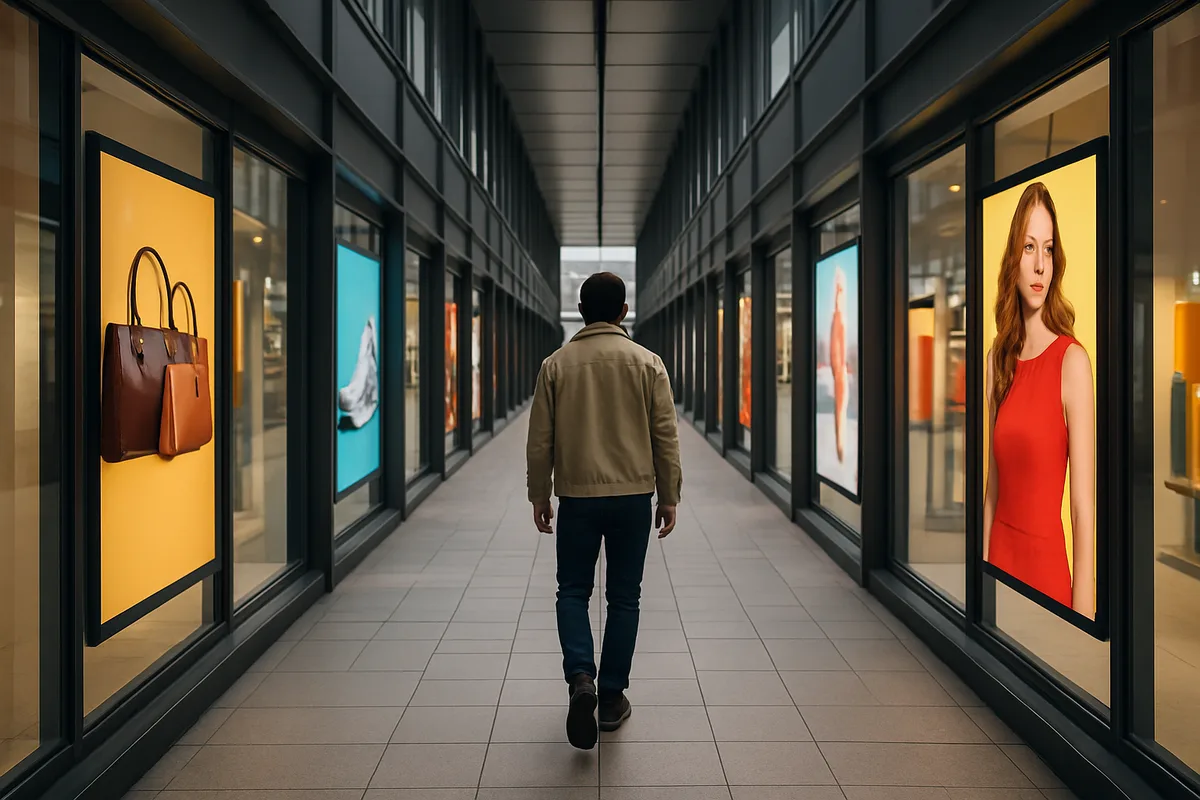
Best Digital Signage Platforms for High Street Windows
Compare the best digital signage platforms for high street windows. Architecture, ROI metrics, and content strategies to maximize storefront engagement.
Read article →
How to Calculate Digital Signage ROI Accurately
Learn how to calculate digital signage ROI accurately with a practical framework covering costs, sales attribution, and analytics tools that prove screen investments work.
Read article →Our Standard
We don't sell dashboards.
We ship measurement that works.
If it can't run across a thousand screens, it's a prototype.
If it can't explain why, it's a black box.
If it compromises trust, it doesn't belong in physical space.