Why Grocery Stores Need the Best Foot Traffic Tools in 2026
The best foot traffic tools for grocery stores aren't optional anymore — they're a direct line to protecting thin margins. U.S. grocery stores have seen average weekly foot traffic decline 12% from 2019 peaks, yet some chains report flat traffic with 5–7% sales growth by improving conversion. That gap between visits and revenue is where the real money hides.
Traditional GPS-based sensors miss 40–50% of indoor movement. Grocery environments are particularly hostile to these older methods: dense metal shelving, refrigeration units, and constantly shifting cart traffic all degrade signal quality. You're making staffing and stocking decisions on half the picture.
Food waste tied to traffic mismatches costs U.S. grocers $18.1 billion annually. Only 20–30% of grocery visitors actually convert to purchases, partly because operators can't see where shoppers stall, loop back, or abandon their trip entirely.
The in-store analytics market will reach $16.51 billion by 2030 at a 21.8% CAGR, with traffic analytics alone accounting for 28% of that revenue. Grocery leads adoption because physical visits still drive 70–80% of sales. If you run hundreds of stores, even a 2% improvement in conversion compounds into millions.
Best Foot Traffic Tools for Grocery Stores: Performance Comparison
High ceilings, wide entrances, multi-door layouts, and carts carrying multiple shoppers create unique counting challenges. Here's how the main technology categories perform in real grocery environments.
Mobile Location Intelligence Platforms
These platforms aggregate anonymized GPS and app-derived signals from millions of mobile devices. One leading provider reports 94% accuracy correlation to ground-truth sensors across 1.5 million+ U.S. store locations. Another processes data from millions of devices to deliver 90-day predictive feeds tuned for grocery.
Strengths: massive geographic coverage, competitive benchmarking across trade areas, and historical depth spanning 5+ years. Weaknesses: accuracy depends on app penetration rates, and they capture external visit patterns better than in-store movement.
Thermal Sensors with POS Integration
Body heat detection achieves 99% entry accuracy — no cameras, no personal data. Direct POS system integration gives you unified traffic-to-sales conversion updated in real time.
Strong at entrance counting and shift-level staffing analysis. They won't tell you what happens inside the store, though. For a 50,000-square-foot grocery floor, you'll need additional technology to track aisle-level behavior.
Video Analytics and Path Mapping
AI-powered video systems map shopper paths, measure dwell times, and identify directional flow. Large grocery chains deploying this technology have seen conversion rates climb 14% by redesigning layouts based on actual shopper movement data.
Higher installation cost, more complex privacy compliance, and longer deployment timelines — especially across hundreds of locations with varied ceiling heights and lighting conditions.
Sensor Fusion (Wi-Fi + Beacons)
Wi-Fi detection combined with Bluetooth beacons delivers complete in-store journey mapping. This approach has produced 20% dwell time improvements in high-traffic aisles and enables campaign attribution, connecting specific promotions to 10–15% traffic uplifts in targeted zones.
Best for operators who need granular aisle-level data but requires more infrastructure than single-sensor approaches.
Documented Results: Traffic Data Reducing Operational Costs
Here's what actual grocery operators have achieved with foot traffic tools — measured in dollars, labor hours, and spoilage rates.
A major U.S. grocery chain with 2,700+ stores used mobile location analytics to identify an 18% traffic shift toward suburban locations after 2023. Armed with that data, they restructured store layouts in high-growth markets and achieved a 7% sales lift.
Grocers using geo-location tools achieve 104% greater profit growth compared to non-adopters, according to IHL Group research. A significant driver? Aligning inventory replenishment to actual traffic patterns instead of static schedules. One mid-tier chain matched traffic peaks to inventory cycles and cut spoilage by 22%. Another group of food retailers using traffic-aligned surplus sales strategies reduced waste by 20–30%.
A grocery chain integrating thermal counters with its POS system achieved 12% staffing optimization by matching shift schedules to verified peak traffic windows. Before the integration, they were carrying 15–20% excess labor during lulls — a cost that's invisible without accurate traffic data.
Retailers using traffic analytics to manage workforce allocation report labor cost reductions of 15–20%. For a chain running 500 stores with an average labor budget of $1.2 million per location, even a 10% efficiency gain represents $60 million annually.
Implementation Strategy: Accuracy vs. Coverage vs. Cost
Choosing the best foot traffic tools for grocery stores involves three competing priorities. You can't maximize all simultaneously, so knowing your main objective matters.
Accuracy-First Approach
Thermal sensors deliver 99% counting accuracy without privacy concerns. Fast installation. Easy for staff to trust. The limitation: they only count entrances and exits. If your primary need is matching headcount to register staffing, this is the right starting point.
Coverage-First Approach
Mobile location platforms cover millions of devices across entire trade areas, giving you competitive benchmarking and site selection data that no on-premise sensor can match. Data quality varies by geography and demographic. Urban stores with younger demographics see higher app penetration rates than rural locations serving older shoppers.
Budget-Conscious Rollouts
Most traffic analytics providers now offer pricing tiers under $5,000 monthly, with 90-day trial periods that reduce risk for chain-wide rollouts. Start with a 10–15 store pilot in representative formats — urban flagship, suburban mid-size, and rural small-format — then scale based on measured impact.
Sensor fusion (combining Wi-Fi and beacons) costs more upfront but delivers the most complete picture. Chains that have deployed it report 20% dwell time improvements in reconfigured aisles — a metric that directly connects to basket size.
Grocery-Specific Features That Drive Store Floor Efficiency
Generic retail analytics won't account for grocery's unique operational realities: perishable inventory, high visit frequency, wide format variation, and razor-thin margins. Here are the grocery-specific capabilities that separate useful tools from expensive dashboards.
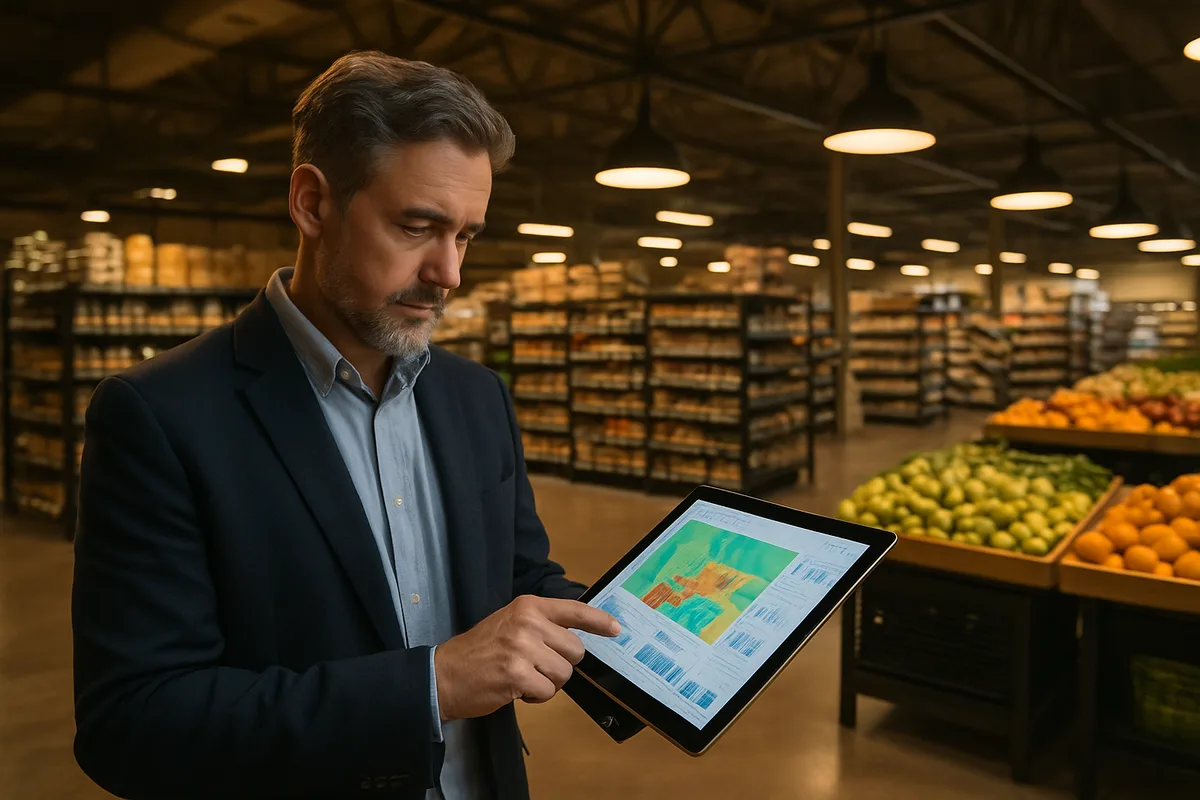
Heat Mapping for Aisle-Level Visibility
See where customers cluster, skip, and where congestion slows throughput. In grocery, this means identifying whether your deli counter creates a bottleneck that blocks access to adjacent high-margin categories. One chain found that repositioning a promotional endcap based on heat map data increased category sales 11% in that zone.
Predictive Staffing Alignment
Traffic prediction models account for day-of-week patterns, weather, local events, and seasonal shifts. Build schedules 2–3 weeks out with higher confidence. The payoff is concrete: 15–20% reduction in excess labor costs during low-traffic windows, without risking service quality during peaks.
Competitive Benchmarking Across Trade Areas
Knowing your own traffic is table stakes. Knowing how your traffic compares to the grocery competitor 800 meters away — and whether their Tuesday promotion is pulling your Wednesday shoppers — is where strategic decisions get made. Platforms covering 1 million+ trade areas enable this kind of analysis, informing both marketing spend allocation and new site selection.
Inventory System Integration
The highest-value grocery application connects traffic data directly to replenishment systems. Know that Thursday evening traffic is 30% higher than your current stocking model assumes? Push fresh inventory to the floor before peak — not after half your shoppers have already left. Traffic-based replenishment has cut spoilage by 22% in documented deployments.
Grocery margins don't leave room for guessing. Every hour of excess staffing, every pallet of spoiled produce, and every lost conversion represents profit walking out the door. The tools exist to fix this. The operators adopting them are already pulling ahead: 104% greater profit growth, 22% spoilage cuts, double-digit staffing savings. The question isn't whether traffic analytics work in grocery — it's how quickly you can get accurate data flowing into the decisions you're already making every day.
Sources
- Too Good To Go — Comparison of traditional vs. modern foot traffic analytics tools, citing Grand View Research market data
- Placer.ai Grocery Industry Trends — Grocery-specific foot traffic data and chain performance analysis
- PassBy — Accuracy benchmarks and provider comparison for foot traffic data across 1.5M+ U.S. locations
- Shopify — Retail foot traffic data integration with POS systems and staffing optimization
- Techsalerator — Overview of top retail foot traffic data providers and market trends
- Korem — Using foot traffic data for retail site selection and competitive analysis
- SMS Storetraffic — People counting solutions for large retail chains with accuracy validation