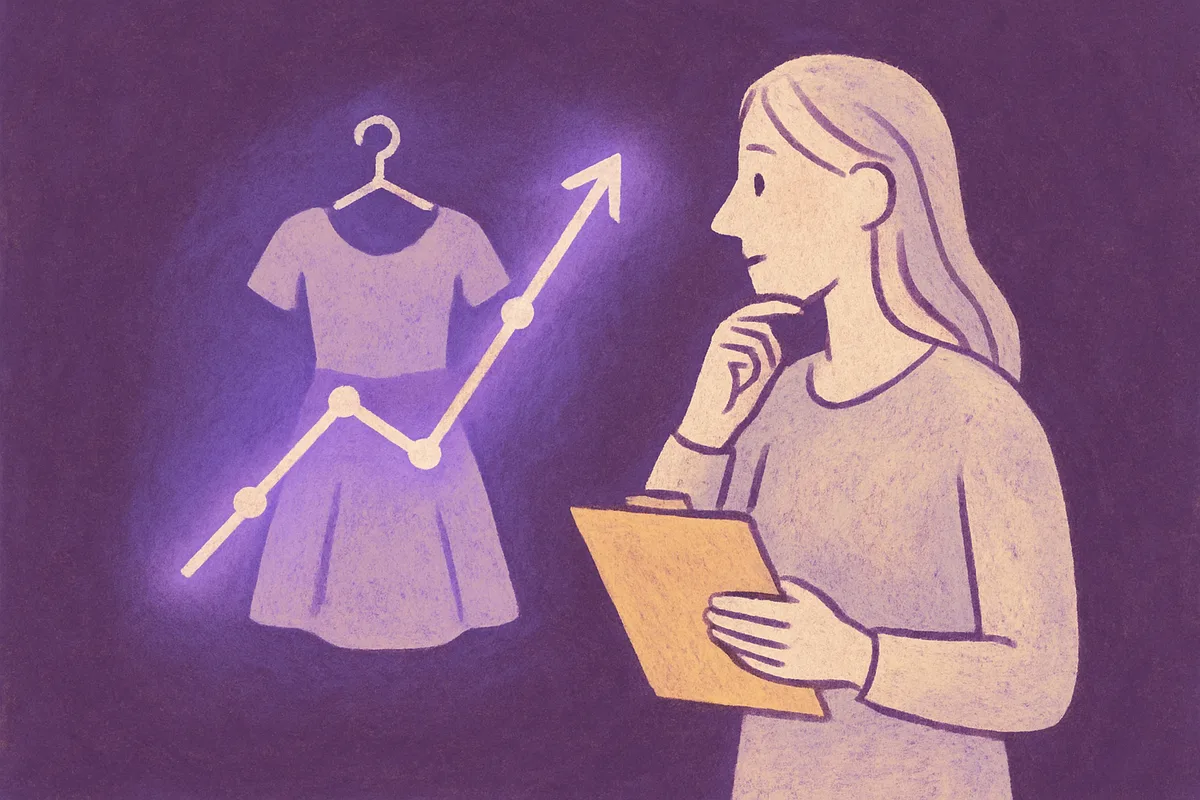
Most fashion retailers run seasonal reviews as an autopsy. The collection is dead, the markdowns are already applied, and the analysis just confirms what everyone suspected in week nine. That's a waste. Fashion retail analytics for seasonal collection performance only protects margin when it feeds decisions during the season window — while there's still full-price revenue to save and campaign budget left to redirect.
This piece reframes seasonal analytics as a live, predictive discipline — connecting behavioral signals, sell-through velocity, weather patterns, and mobile data to the calls you make in weeks two through six, not the report you file after the season closes.
Why Seasonal Collections Are the Highest-Stakes Arena in Fashion Retail Analytics for Seasonal Collection Performance
Compress most of your annual revenue into 6 to 12 weeks and every forecasting error becomes a margin event. That's the structural reality of seasonal collections, and it's why analytics accuracy here is a direct profit lever — not a reporting nicety.
Winter and fall collections each account for roughly 25% of annual fashion revenue, driven by premium-priced outerwear, knitwear, and footwear. The holiday window alone — November through December — delivers approximately 60% of annual online apparel sales. That's the majority of your digital year squeezed into 8 or 9 weeks.
The pressure doesn't ease from the macro side either. McKinsey projects low single-digit growth — roughly 2 to 4% — for global fashion through 2025 and 2026. You can't count on a rising market to paper over planning mistakes anymore. And "peak season" no longer guarantees anything: clothing and textile store sales in France fell 4.7% in December 2025 versus December 2024 — during the holiday peak, despite promotions running. If the busiest weeks of the year can go backward, guessing through a collection is a losing bet.
The Four Seasonal Blind Spots That Drive Margin Erosion
Most seasonal underperformance traces back to four compounding blind spots: late sell-through reads, weather-ignorant forecasting, siloed channel data, and static assortment assumptions. None of these is an operational failure. They're data gaps — and analytics can close every one.
Late Sell-Through Identification Turns Manageable Slow Movers Into Deep-Markdown Events
Strong seasonal items typically hit 50% or more sell-through within 30 days. A style stuck at 20% at the same checkpoint almost always ends in heavy markdowns. The signal is there early — the question is whether anyone reads it.
Usually they don't. Most retailers apply the first markdown 8 or more weeks into a season that often runs only 6 to 12 weeks. By then, the discount has to be far deeper than an early nudge would have needed. Without week-level velocity tracking by style, the slow mover looks fine right up until it doesn't — and by that point you're liquidating at full-price margin's expense.
Weather Volatility Is Treated as an Anomaly Instead of a Forecast Input
Boot sales spike during rainy weeks. Shorts stall in a cool June. These aren't anomalies — they're predictable demand levers that most planning teams shrug off as noise.
Without correlating local weather with SKU-level sales, you're left with unexplained variance in seasonal results. That variance then feeds the next buy plan, wrong. A cold October read as "strong outerwear demand" sets inflated expectations for a warmer October next year, and the error compounds season over season.
Disconnected Channel Analytics Hides Where Seasonal Campaigns Actually Win or Lose
Mobile now drives 56.4% of holiday online spend — the first full year it crossed 50% — and roughly 66% of seasonal fashion purchases globally. Yet many retailers still measure desktop and mobile funnels with the same metrics, hiding device-specific friction on the channel that carries most of the revenue.
The deeper problem is attribution. When in-store, e-commerce, and app data sit in separate systems, you can't tell whether a seasonal campaign pushed shoppers to the store, the app, or both. Return reasons and wishlist signals from digital channels never reach the buying team's planning workbooks either — so the same fit and demand mistakes repeat.
Static Assortment Assumptions Lock In the Wrong Category Mix Before the Season Starts
Pre-season buys get built on last year's category splits, and those splits rarely reflect where demand is actually heading. During a cost-of-living squeeze, a plan weighted toward occasionwear underperforms a casualwear-heavy assortment — but only if someone modeled the scenario before the open-to-buy was committed. Most don't.
Size curve rigidity compounds this. Fringe sizes get over-bought, core sizes sell out, and the season ends with a skewed residual that distorts the sell-through read. Without analytics simulating category-mix and size-curve scenarios before the buy is placed, the same categories get over- or under-indexed season after season.
From Dashboards to Decisions: How Fashion Retail Analytics for Seasonal Collection Performance Actually Works
There are three modes of seasonal analytics: descriptive (what happened), predictive (what will happen), and prescriptive (what to do about it). Most retailers are stuck in the first mode — staring at last week's numbers with no engine to act on them.
The gap between modes is measurable. McKinsey data cited in Retalon's analysis indicates companies using advanced analytics outperform competitors by 68% on key metrics — margin, stock turns, and sell-through rate among them. That's not a rounding difference. It's the space between reacting and predicting. In-store analytics vendors such as Pygmalios sit in this broader ecosystem, giving physical retail teams the zone-level behavioral data they need to participate in that same predictive loop.
Sell-Through Velocity Tracking at 30, 60, and 90 Days
Velocity dashboards do one job well: they separate fast movers from slow movers inside the season window, while there's still time to respond. A style pulling ahead becomes a reorder candidate or gets extended campaign support. A laggard triggers early promotion, merchandising repositioning, or a controlled markdown before the price has to crater.
Week-over-week comparisons within the same period sharpen the picture further — the second week of November versus Black Friday week reveals micro-trends you can act on, shifting media spend toward the capsule that's accelerating instead of the one you planned around six months ago. Tracking full-price versus markdown share inside the season is also the input that corrects next year's buy quantities and timing.
Weather-Integrated and Behavioral Demand Forecasting
Advanced platforms pull local weather forecasts straight into short-term allocation. More rainwear ships to regions expecting storms; outerwear content gets pulled forward ahead of a cold front. The forecast becomes a lever instead of an excuse.
Behavioral signals do similar work earlier in the cycle. Search queries, wishlist adds, product views, and cart abandonments act as leading indicators of seasonal demand before sell-through data has matured enough to trust statistically. On the assortment side, AI models simulate category-mix scenarios — flagging, for instance, when budget parked in occasionwear should move to casualwear during a cost-sensitive season. That matters right now: over 60% of consumers report intent to cut seasonal fashion spending.
Unified Planning: Connecting Buying, Merchandising, and Marketing to One Seasonal View
A unified analytics layer creates a single view of seasonal performance — by SKU, category, channel, and region — visible to every function at once. That shared visibility is what lets a marketing team redirect spend toward styles showing strong early velocity instead of running the original media plan against products already sliding toward markdown. From the physical retail side, connecting in-store traffic and conversion data to the same seasonal view means the store floor isn't a blind spot when the broader picture is assembled.
The practical payoff is that functions stop optimizing against each other. Planning chases intake margin, marketing chases clicks, merchandising chases stock turns — and each pulls in a different direction when those goals conflict. One data layer doesn't eliminate that tension, but it makes the trade-offs visible before the season ends rather than after.
The Metrics That Actually Measure Seasonal Collection Success
Pick the wrong headline metric and a bad season can look fine on paper. Aggregate seasonal revenue is the most common offender — it doesn't distinguish between full-price sales, markdown volume, and a channel-mix shift. Three very different outcomes, one misleading number.
A tiered KPI set avoids this. At the style level: sell-through velocity and full-price sell-through rate. At the assortment level: category contribution and margin by month. At the campaign level: omnichannel attribution, with mobile-specific conversion tracked separately from desktop — because mobile drives the majority of seasonal online revenue, and blending the two hides where friction actually sits.
Weight margin tracking by category, not the season average. Winter apparel carries roughly 50% higher spend per item than summer categories, thanks to premium fabrics and layering complexity. Blend those into one figure and you'll misjudge where the profit sits — a winter collection that looks margin-flat may actually be losing on casualwear and winning on outerwear, and the average tells you nothing about which to back next year.
Close the loop. Full-price sell-through rate, markdown depth, and return rate by style should feed straight into the next season's buy plan. The end-of-season review isn't a closing report — it's the opening data set for the next cycle.
Where Fashion Retail Analytics for Seasonal Collection Performance Is Heading by 2027
More data isn't the next evolution. Faster, more granular decision loops are — built around micro-seasons, AI-generated demand signals, and sustainability as a measurable planning input. Use this to judge which capabilities to prioritize now versus build toward.
Micro-Seasons Replace the Four-Season Calendar
Leading retailers already treat collections as micro-seasons — Festival Drop, Back to Campus, Holiday Partywear, Early Spring Transition — each with its own analytics model, KPIs, and buy-react loop. Four broad seasons is too coarse a lens for how people actually shop.
These windows demand weekly sell-through granularity and faster markdown triggers, compressing the decision cycle from months to weeks. The volatility justifies it: 17% of consumers shop weekly for party and summer looks during festival peaks. Demand that fluid needs a near-real-time response, not a monthly review.
AI-Generated Demand Signals and Climate-Adjusted Planning
Social trend signals, search data, and on-site behavior will increasingly convert into demand scores for upcoming drops — letting you adjust buys before production commitments lock. Catching a rising silhouette in the signal is worth far more than confirming it in the sell-through data three weeks later.
Climate shift is also forcing a rethink of the calendar itself. Later winters and hotter springs keep misaligning with traditional collection timing, so delivery windows and promotional calendars will have to move with them. Retailers that baked weather correlations into their planning models early will have a structural advantage over those still treating seasonal anomalies as one-offs.
Sustainability as a Measurable Seasonal Variable
Sustainability is moving from brand messaging to planning input. During spring and festival seasons, 94% of consumers report supporting sustainable clothing — a signal strong enough to affect assortment weighting, not just marketing copy. Resale is scaling fast enough to create real cross-season demand effects too: the market is projected to reach 10% of global apparel sales by 2025, up from $25 billion in 2020 toward $192 billion by 2030.
Analytics will start tracking how resale availability of prior-season stock affects demand for new collections, and routing end-of-season residuals to resale channels instead of deep-markdown fire sales. The retailers who win the next few seasons won't be the ones with the most data. They'll be the ones who act on it while the season's still open.
Sources
- McKinsey — State of Fashion 2025 — global growth projections for fashion through 2025 and 2026.
- Retalon — Fashion Analytics — descriptive/predictive/prescriptive framework, unified planning practice, and the 68% analytics-outperformance benchmark (citing McKinsey).
- Adobe Holiday Shopping Report — mobile's 56.4% share of holiday online spend, November–December 2025.
- Seasonal Fashion Buying Habits Statistics — seasonal revenue shares, mobile transaction share, spend intent, and sustainability data.
- Peasy — Seasonal Analytics for Clothing Stores — sell-through velocity thresholds and markdown timing benchmarks.
- Republik Retail — French Fashion Market 2025 — December 2025 clothing sales decline versus December 2024.
- Latico — Is the Fashion Industry Growing — resale market growth projections through 2030.