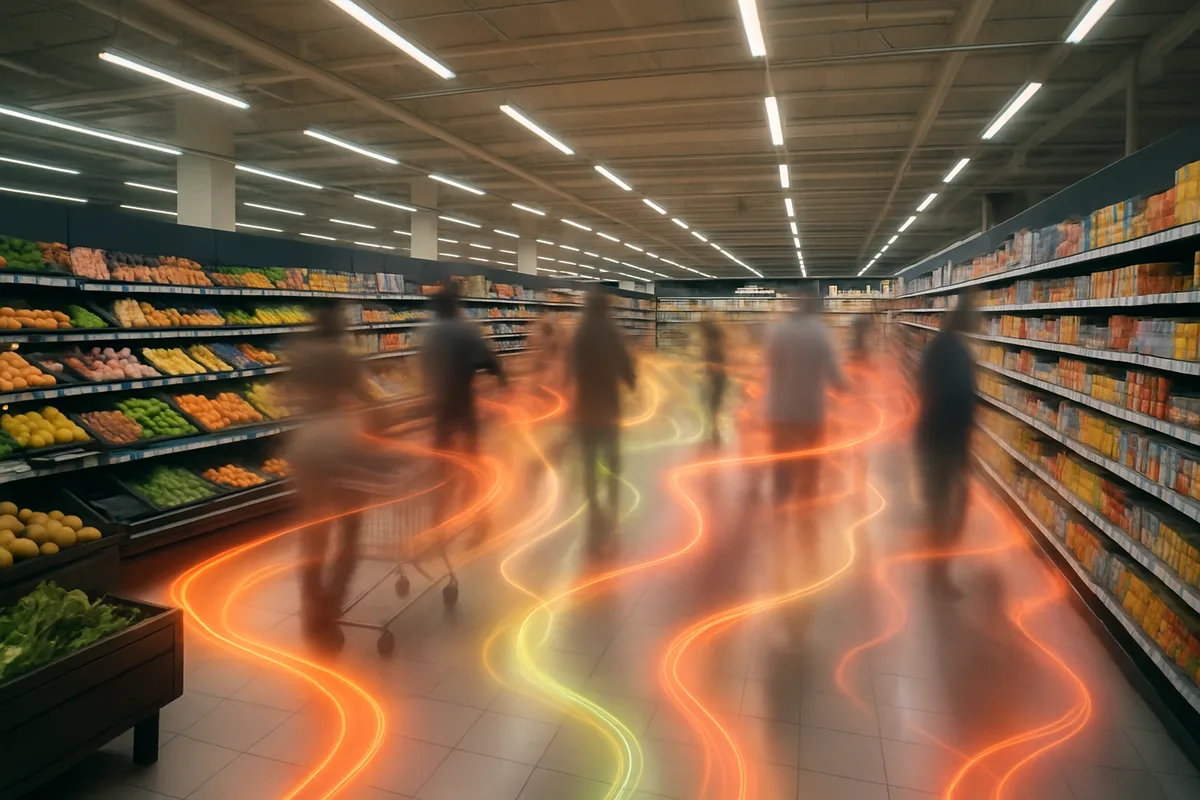
Knowing how to use retail heatmaps in FMCG supermarkets separates operators who guess where stores bleed money from those who see it. Supermarket net margins sit between 1% and 3%. A 1–2% conversion lift from smarter layout decisions isn't nice-to-have — it's the gap between red and black on your P&L. Heatmaps deliver that lift by turning anonymous shopper movement into visual, actionable data you can deploy today and scale across hundreds of stores.
Physical stores still capture 72–75% of global retail sales. Grocery skews even higher — over 85% in most mature markets. The opportunity isn't shrinking. But the tolerance for operational blind spots is.
Five Critical Blind Spots Retail Heatmaps Eliminate in FMCG Operations
POS data shows what sold. It can't reveal what didn't sell because nobody walked past it. That's the core problem, creating five specific blind spots that drain margin every week:
- Dead zones eating premium real estate. Back corners, non-essential side aisles, far store ends absorb rent, inventory capital, and labor without generating proportional revenue. Heatmaps make them visible in seconds.
- Bottlenecks causing basket abandonment. Narrow aisles near promotional islands, congested fresh counters, crowded entry zones. Shoppers don't complain — they shorten trips and skip aisles, shrinking baskets without warning signs.
- Misaligned staffing schedules. Most stores staff by historical rules of thumb. Fresh produce might be understaffed at 5 PM Wednesday while household goods is overstaffed all morning. Without zone-level traffic data, you're allocating labor blind.
- Promotional displays in low-traffic areas. Seasonal endcaps in cold zones burn marketing spend. Heatmaps show exactly how many shoppers walk past — and how many actually stop.
- Queue management gaps. Excessive checkout lines cause full-cart abandonment and reduce visit frequency. Most chains lack real-time, objective measurement of queue length per lane.
Each blind spot is fixable once visible.
Technology Stack for Actionable Retail Heatmap Data
Technology choice determines your accuracy ceiling, privacy posture, and how insights plug into existing operations.
3D People-Counting Sensors vs. Overhead Camera Systems
Stereo-vision 3D sensors deliver high-accuracy counts and dwell data while anonymizing by design — no identifiable imagery stored. They excel at entrances, aisles, and checkout zones. Overhead camera systems powered by computer vision track full shopper trajectories across wider areas and generate richer path data. The trade-off? Cameras require more processing power and tighter privacy controls.
Many supermarket deployments combine both approaches. Sensors handle precise zone-level counting while cameras provide path-level context.
Integration Requirements
Heatmaps that don't connect to POS, workforce management, and promotion calendars are pretty pictures. Nothing more. You need APIs that let you ask: "Zone 4 had 1,200 visitors yesterday — how many bought something from that aisle?" Without that connection, you can't calculate zone conversion or promotional ROI.
Edge Computing and Privacy Compliance
Under GDPR, on-device anonymization isn't optional. Modern edge compute hardware runs computer vision models locally, extracting anonymized coordinates and aggregated metrics. No video leaves the store. No faces are stored.
How to Use Retail Heatmaps in FMCG Supermarkets: Four High-ROI Strategies
Once sensors are live and data flows, here's where the money is:
1. Move High-Margin Categories Into Proven Hot Zones
Heatmaps reveal natural traffic magnets — usually fresh produce, bakery, and main corridor endcaps. High-margin categories like premium snacks, health and beauty, or ready-to-drink beverages often sit in low-traffic mid-store aisles because of legacy planograms. Relocating even secondary placements into hot zones can lift category sales by 2–5%. One move. Measurable in weeks.
2. Real-Time Queue Management
Set line-length thresholds — say, five people or a two-minute wait. When sensors detect the threshold, the system triggers alerts to open additional lanes or redeploy staff from quiet zones. Reducing perceived wait time by one minute lifts satisfaction scores 10–15% and cuts abandonment by 5–10%. That's recovered revenue with zero additional headcount.
3. Strategic Promotional Display Placement
Stop guessing where to put seasonal displays. Pull 90 days of heatmap data. Identify zones with the highest stop rate — the percentage of passers-by who actually pause. Place displays there. Then measure traffic, dwell, and POS conversion versus previous campaigns. You build a ranked list of display positions by proven engagement.
4. Labor Allocation by Zone and Time-of-Day
Aggregate heatmap data by hour and day-of-week to build staffing grids at zone level. Fresh produce 4–7 PM on weekdays? Heavy traffic — staff accordingly. Drinks and snacks Friday evening? Spike. This replaces store-average scheduling with micro-scheduling that matches bodies to actual demand.
KPIs That Translate Heatmap Insights Into Store Profitability
Four metrics make heatmap data operational:
- Zone conversion rate. Traffic entering a zone divided by transactions containing products from that zone. Most stores have never measured this.
- Dwell time vs. basket size. Track correlation between average dwell in a zone and average basket value of shoppers who bought from it.
- Labor productivity per square foot. Staff hours allocated to a zone divided by that zone's revenue.
- Promotional ROI by placement. Engagement rate (stops ÷ passers-by) multiplied by conversion, compared against placement cost and promotional margin.
Case Study Results: Proven FMCG Applications
Coca-Cola's convenience retail heatmap study revealed that placing incremental coolers near checkout — the zone with highest natural traffic — generated a 16-point organic increase in incremental cool beverage purchases. Coolers near food-service counters also worked but competed with coffee and fountain drinks.
Broader supermarket results show consistency. Retailers that systematically optimize layout using traffic data achieve 2–5% sales uplift in affected categories and 0.5–2% at total store level. Addressing dead zones through wider aisles, better signage, or pulling popular products into neglected areas increases traffic to those zones by 10–30% and dwell time by 15–40%.
Installation and annual subscription typically runs $3,000–$10,000 per large store, including hardware, software, and support. Payback periods of 6–18 months are standard when deployment pairs with clear action plans.
Implementation Roadmap: From Pilot to Chain-Wide Deployment
Pilot Selection: 5–20 Stores
Pick stores representing format diversity — flagship hypermarkets, mid-size supermarkets, compact urban locations. Include high-performing and underperforming sites. Focus sensors on entrances, main aisles, fresh perimeter, promotional zones, and checkouts.
Integration Planning
Before sensors go live, map data flow. Heatmap outputs need to reach your POS system (for zone conversion), workforce management platform (for staffing alerts), and space planning tools (for planogram adjustments).
Staff Training
Store managers don't need to become data scientists. They need dashboards that say: "Traffic to baby aisle up 18% since the move to main corridor." Build simple KPI cards, train managers on weekly review cycles, and create playbooks.
Scaling to Hundreds of Locations
Standardize zone configurations across similar formats so KPIs are comparable chain-wide. Create templates: "Format A stores use these 12 zones; Format B uses these 8." This lets central teams benchmark performance and spot outliers.
Future-Proofing: AI-Driven Layout Optimization in 2026–2027
The in-store analytics market is projected to grow from roughly $3.2–3.5 billion in 2023 to $8–9 billion by 2030.
Machine learning for category adjacency. Models trained on historical heatmap and sales data will recommend optimal product pairings. Instead of running one A/B test at a time, algorithms will simulate hundreds of layout scenarios and rank them by predicted lift.
Real-time automation triggers. Queue alerts are just the start. Expect auto-replenishment signals when dwell and pick-up rates spike at displays, dynamic digital signage that shifts promotional content based on current zone traffic, and smart checkout systems that open lanes without manager intervention.
Multi-modal sensing. Heatmaps combined with shelf-edge cameras, electronic shelf labels, and IoT pick-up sensors will distinguish between low sales caused by low traffic versus out-of-stocks.
Sources
- Coca-Cola Lens — Convenience Retail Heat Map — study on incremental cooler placement and the 16-point purchase increase
- Ariadne — Retail Store Heatmap Analytics — dead zone elimination, staffing optimization, and queue management use cases
- Xovis — Heat Maps in Retail: Understanding Zones of Interest — 3D sensor-based heatmap methodology and zone analysis
- Flame Analytics — From Cool to Hot: How to Create a Heat Map for Your Shop — cost benchmarks and practical deployment guidance
- Mediar Solutions — Heatmapping in Retail — multi-sensor approaches combining video analytics, IoT, and POS integration
- Cascadia Capital — Retail Technology Industry Report 2H 2024 — market sizing and location analytics adoption trends