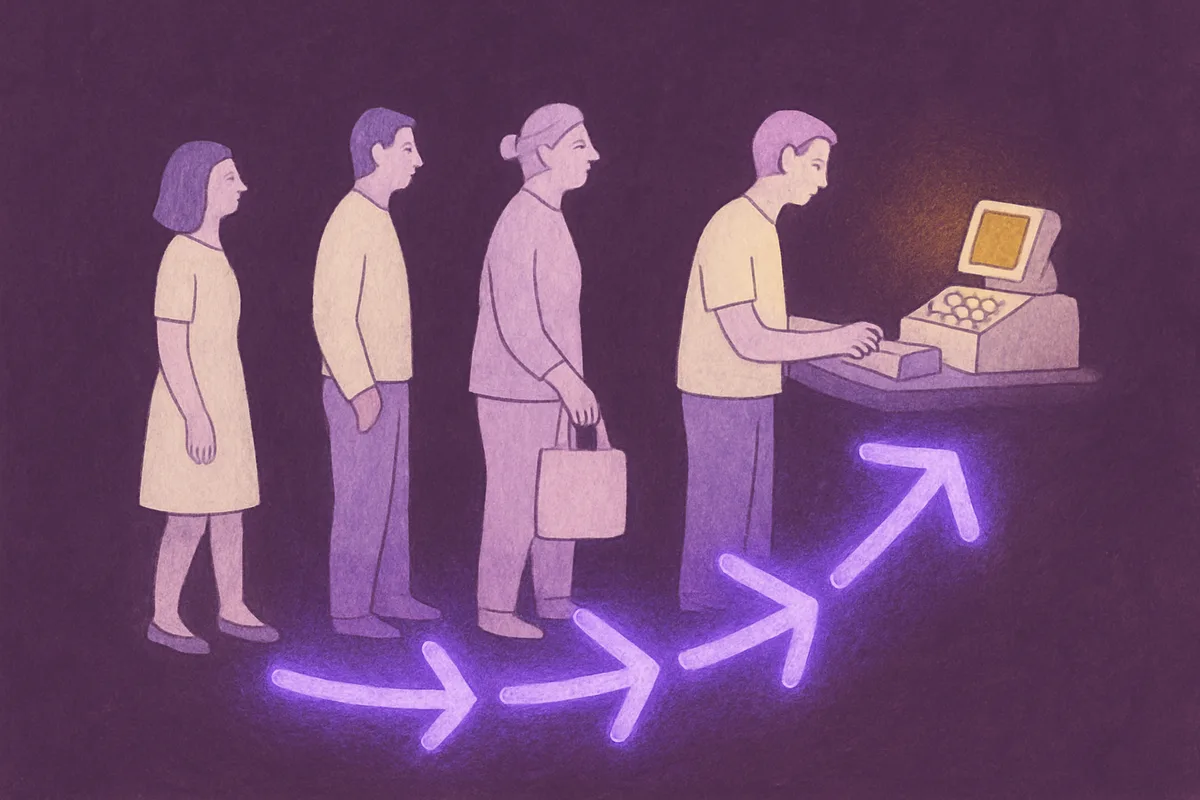
Why Queue Analytics for Food Retail Checkout Is a Revenue Problem First
Queue analytics for food retail checkout isn't an operational nicety — it's a revenue protection strategy. Long lines at the till drain an estimated $38 billion a year from U.S. retailers through cart abandonment and store avoidance. That figure alone should reframe how you think about the checkout: it's the single highest-stakes point in the entire shopping trip.
Think about what actually happens at the register. A shopper has walked your aisles, filled a basket, and decided to buy. Then the queue does the one thing nothing else in the store can do — it turns a completed basket into a zero-dollar transaction. When wait time crosses five minutes, roughly one in three customers abandon their purchase. For a mid-sized supermarket under typical traffic, that maps to about $900,000 in lost revenue per location, per year.
The damage doesn't stop at the walkout. Long queues bleed loyalty too. Research shows 77% of shoppers are less likely to return after a bad checkout experience, and nearly 40% of grocery shoppers aren't tied to one store — they'll switch for faster checkout. Queue friction is a retention risk, not just a throughput headache.
Every minute you shave off average wait time has a calculable dollar value. Queue analytics is the tool that lets you run that calculation — and act on it before the money walks out the door.
The Five Queue KPIs That Actually Predict Checkout Performance
Most checkout operations run on observation, not data. A front-end manager glances at the lanes, decides they look busy, and calls for help — usually too late. The shift to queue analytics for food retail checkout starts with five specific metrics that predict both customer behavior and revenue.
- Average wait time — the threshold metric that drives abandonment.
- Customers served per hour — real throughput per lane, not a guess.
- Peak service hours vs. assumed peaks — where your schedule and reality diverge.
- Queue abandonment rate — the direct link between wait and lost sales.
- Service level compliance per lane — whether standards actually hold.
Average wait time is the sharpest of the five. Once a queue passes five minutes, perceived wait time roughly doubles in a customer's head — meaning the behavioral gap between a four-minute wait and a six-minute wait is far bigger than the clock suggests. Manage to the perception, not just the stopwatch.
Peak service hours expose the scheduling problem directly. Stores staff by habit — "Saturdays are busy" — rather than by measured traffic. That habit creates predictable understaffing windows, and those windows are where abandonment concentrates. Fix the schedule to match the real demand curve and much of the queue problem takes care of itself.
Queuing theory backs up why five minutes is such a sensitive line. A two-server checkout under busy conditions produces an average queue of 6.856 customers and a wait of about 4.2 minutes — just under the danger threshold. A small traffic spike tips a "fine" queue into an abandonment queue almost instantly.
How Computer Vision and AI Deliver Real-Time Queue Analytics for Food Retail Checkout
Computer vision turns your existing CCTV into an active queue measurement engine. In most deployments there's no new hardware footprint — the cameras you already run for security become the sensors that count and time your queues.
The mechanics are precise. Modern systems use YOLO-based object detection with centroid polygon hit-testing to identify a customer inside a defined checkout zone. Each person gets a unique tracking ID. A timer starts the moment they enter the zone and resets when they leave, using frame-rate logic to produce accurate per-customer checkout times — no clipboard, no manual observation.
Layer people-counting and queue-counting sensors on top and the picture sharpens. These systems report average wait time, customers per lane, and the cashier count needed to hold your targets. When a queue passes a configured limit, they push a threshold alert — email or mobile — straight to the front-end manager. Tie in the entrance counter and staff get warned as traffic builds, not after the line forms.
Self-checkout monitoring is where two budgets stop competing. Computer vision counts items on the conveyor and compares them against scanned items, so the same system that eases queue congestion also flags shrink risk. Checkout speed and loss prevention usually fight for spend — here they share the same camera feed.
All of it rolls up into a live dashboard: queue length, wait time, and lane-level throughput in one overlay view. Queue decisions move from "does that line look long?" to a data-triggered protocol that fires the same way every time.
Translating Queue Data into Labor Decisions and Service-Level Standards
Analytics only cuts abandonment when it triggers a staffing response. A dashboard that populates a report but changes nothing on the floor is just decoration.
Start with a tolerance standard and a safety valve. A "1 + 2" policy — one customer being served, two waiting — sets the threshold for opening another lane. Enforce it with data, not a manager's read on how tired the shift is. The rule stays constant across every daypart.
From there, AI platforms calculate actual peak service hours from transaction and queue data. Feed those empirical demand curves into workforce management and you replace assumption-based schedules with something that matches how customers really arrive. The 3 p.m. lull that never got staffed stops being a surprise.
Overstaffing carries its own cost — it's just a quieter one. Queue analytics gives you the precision to add cashiers exactly when demand climbs and pull them back when it drops, instead of choosing between chronic over-staffing and chronic understaffing.
Measuring ROI Before Signing a Vendor Contract
Model your own revenue exposure before you talk to a single vendor. Every input already sits in your POS data.
Here's the framework. Take daily transaction volume, apply a 33% abandonment rate during peak periods, and multiply by average basket value. The $900,000-per-location ceiling established earlier is the starting point — the recovery math is what matters:
- Cut abandonment in half at a store doing 500 transactions per day at a $15 basket, and you recover roughly 82 transactions daily.
- That's about $1,230 per day — or around $449,000 a year, per location.
- Retailers using AI video analytics for queue management have reported a 25% increase in sales conversion. Use that as a sanity check on your model, not a guarantee.
That recovery number is your benchmark — measure any analytics investment against it, not against a vendor's feature list. Then run a pilot before committing chain-wide. A sensible structure: 3 to 5 stores, 8 to 12 weeks, with before-and-after measurement of average wait time, queue abandonment rate, conversion, and labor hours per transaction. That produces a business case in numbers your finance team already trusts.
Validate integration early. Confirm compatibility with your existing IP camera infrastructure, POS data feeds, and workforce management platform. Integration friction is exactly where promising pilots fail to scale — catch it in week two, not month six.
Queue Design as a Checkout Strategy, Not Just a Flow Problem
Analytics tells you how long customers wait. Queue design decides whether that wait builds basket value or destroys it — two very different outcomes from the same minutes.
Hershey's "What is a queue worth?" program is a documented example. Using behavioral data and six design principles, they quantify the incremental sales opportunity inside the checkout queue — treating the line as a merchandising space, not dead time. A well-designed queue with data-informed impulse category placement converts wait time from pure cost into a revenue moment.
Format matters here too. A serpentine single line and a set of short parallel lanes carry different abandonment and impulse-purchase profiles. Queue analytics gives you the data to pick the right configuration per store format, rather than copying the same layout into every location and hoping for the best.
Where Queue Analytics for Food Retail Checkout Is Heading by 2027
The next wave isn't about measuring queues better — it's about eliminating the conditions that create them. Predictive staffing, smarter self-checkout, and edge AI will define the gap between retailers who hold shoppers and those who lose them.
Predictive wait-time modeling. Systems combining live traffic counts, historical day-of-week patterns, and promotional calendars will hand managers staffing recommendations 30 to 60 minutes ahead of a demand spike. You staff the surge before it arrives, not in reaction to it.
Smarter self-checkout ecosystems. As self-checkout share in grocery keeps growing, analytics extends to dwell time per session, assistance call rates, and how efficiently roaming staff are deployed. The question shifts from "how many customers are waiting?" to "why is this one stalled?"
Edge AI deployment. On-device processing cuts alert latency to near-zero and keeps working in low-connectivity stores — making real-time threshold enforcement reliable across every format, convenience and discount included, not just the flagship supermarket.
Convergence with store intelligence. Queue analytics is merging into platforms that span entry traffic, floor heatmaps, category dwell, and checkout. The payoff is a single operational view from the front door to the completed transaction.
The competitive framing is direct. Checkout speed ranks as the third-highest factor in store choice, behind only location and price. Retailers who instrument their checkout with data will keep the shoppers that rule-of-thumb operations quietly hand to the competitor down the road.
Sources
- Leverege — $38B annual loss, shopper loyalty and switching data
- Pygmalios — 33% abandonment rate, per-store revenue modeling, 25% conversion uplift
- Universal Journal of Management — queuing theory benchmarks (Lq and Wq)
- Logile — tolerance standards, safety valves, checkout as a store-choice factor
- The Hershey Company — "What is a queue worth?" queue design program
- InsightAce Analytic — in-store grocery growth and self-checkout expansion