What Foot Traffic Analytics Solve for Telecom Retail Stores
A customer buying a phone case takes three minutes. A customer switching their family to a new plan, trading in two devices, and adding home broadband? That's 45 minutes with a dedicated associate. These long, consultative transactions create unique challenges that foot traffic analytics for telecom retail stores are designed to solve.
Online, every click gets tracked. You know exactly which ad drove a visitor to your plan comparison page and whether they converted. Physical stores? Massive blind spots. Most telecom retailers can't reliably answer basic questions: How many people walked in today? How many left without being served? Did last week's billboard actually drive anyone through the door?
The market recognizes this gap. The in-store analytics market will reach $16.51 billion by 2030, growing at a 21.8% CAGR. Traffic analytics alone represents roughly 28% of that revenue—a $4.6 billion sub-segment. Telecom retailers who ignore this shift aren't just missing insights. They're flying blind while competitors build data-driven operations around them.
Foot Traffic Analytics Technologies for Telecom Environments
Multiple sensor technologies now give telecom retailers the visibility they've been missing. Each carries distinct trade-offs for accuracy, privacy, and insight depth.
Thermal and infrared sensors
Body-heat sensors achieve up to 99% entry accuracy without capturing any personally identifiable information. No cameras, no facial data, no regulatory headaches. For telecom retailers already under scrutiny about data practices, that privacy protection matters. These sensors handle the foundational layer: reliable visitor counts at every door.
AI-powered video analytics
Overhead cameras paired with computer vision track customer paths through the store, measure dwell time at specific zones—the smartphone wall, the accessories display, the business services desk—and monitor queue lengths in real time. For a consultative sales environment where backed-up queues drive walk-aways, this visibility pays for itself.
Wi-Fi and Bluetooth tracking
Device detection analyzes repeat visit rates, zone popularity, and in-store journey patterns. How often does a customer visit before buying? Which zones do they hit first? The answers reshape how you think about the purchase funnel inside your four walls.
POS integration
Traffic technologies reach their full potential when visitor counts connect to point-of-sale data. You get conversion rates, revenue per visitor, and average transaction value segmented by time of day. That's the difference between "we had a busy Saturday" and a precise breakdown of how many visitors converted, at what value, compared to the prior week.
Critical Pain Points That Foot Traffic Analytics Fix
Staffing against unpredictable demand
Telecom traffic spikes don't follow normal retail patterns. A new iPhone launch creates a surge. A regional network outage floods stores with frustrated customers needing support, not sales. Bill cycle dates produce predictable but often-ignored mini-peaks. Staffing decisions that rely on manager intuition mean over-staffing quiet Tuesday mornings and under-staffing chaotic Saturday afternoons.
Traffic analytics replace guesswork with documented peak-hour patterns. You build staffing models around actual visitor flow.
Queue management for long transactions
A 30-minute plan consultation ties up an associate while walk-in customers see a crowded store and leave. You never knew they came. Dwell time data and queue-length monitoring make these invisible losses visible, enabling real-time responses—pulling a stock associate to the floor, activating a digital check-in system, or adjusting appointment-to-walk-in ratios.
Space allocation that follows the money
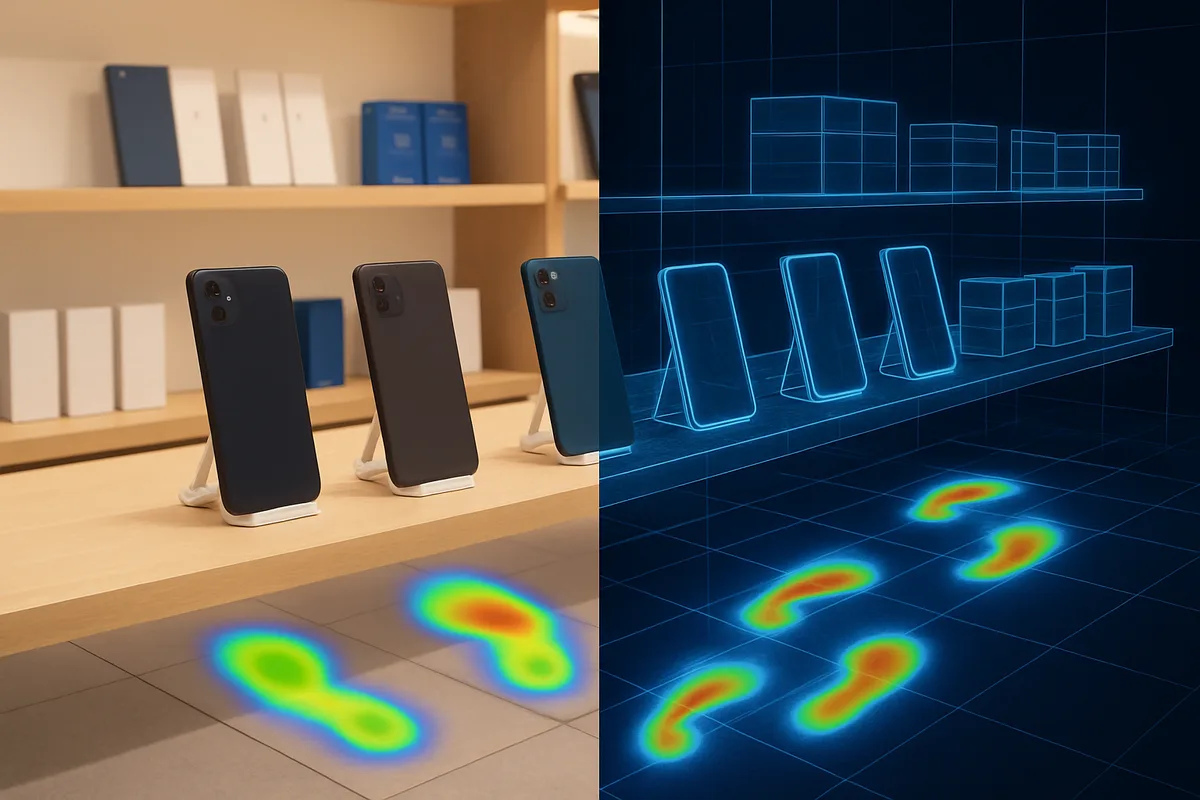
Many telecom stores allocate floor space based on OEM co-funding agreements or headquarters directives rather than actual customer behavior. Path and dwell analytics reveal uncomfortable truths: maybe your accessories wall sits in a dead zone that only 15% of visitors reach, while the high-traffic area near the entrance features low-margin plan brochures nobody picks up.
Heatmaps and zone analytics show which areas attract traffic but don't convert—and which high-margin zones are simply under-visited. That data justifies layout changes with evidence, not opinions.
Campaign attribution that actually works
Location analytics providers report that campaign-driven traffic uplifts of 10–15% in targeted zones are measurable through store-level data. For a telecom marketing team spending heavily on device launches and seasonal promotions, this closes the attribution loop. Did the trade-in billboard work, or was it the weather? Now you can answer that with zone-level traffic and conversion data tied to campaign windows.
Measuring ROI: Performance Impact of Foot Traffic Analytics for Telecom Stores
IHL Group research shows retailers using geo-location and traffic-driven tools see 104% higher profit growth compared to non-adopters. That's not marginal improvement—it's doubling profit trajectory.
More specifically, retailers that align staffing, training, and layout with observed behavior have seen conversion increase by 14%. In telecom, where transactions are high-value and each lost sale carries significant revenue impact, even modest conversion improvements compound meaningfully across a store network.
Conversion rate as a reliable KPI
Visit-to-sale conversion only works as a metric when your visitor count is accurate. A thermal sensor delivering 99% accuracy paired with POS transaction data creates a conversion rate you can actually trust—and benchmark across locations. If one store converts at a significantly higher rate than a comparable location on similar traffic, that's a coaching or experience problem, not a traffic problem. The distinction changes your response entirely.
Site selection and portfolio decisions
Longitudinal traffic trends—tracking pass-by and visit data month over month, year over year—reveal which locations are accelerating and which are structurally declining. Before committing to a lease renewal or a store remodel, you want sufficient traffic trajectory data to establish a reliable trend. That's how you avoid pouring investment into a location where the surrounding trade area is losing traffic to a competing retail corridor.
How to Implement Foot Traffic Analytics Across Telecom Networks
Scaling analytics across hundreds of telecom stores raises practical questions beyond choosing sensors.
Privacy-first architecture
Telecom brands already face regulatory scrutiny around customer data. Any analytics deployment should default to anonymized, aggregated data. Thermal sensors and overhead depth cameras collect behavioral data without capturing faces or identifiable features. When Wi-Fi or Bluetooth tracking enters the picture, permission-based frameworks and clear opt-out mechanisms aren't optional—they're required by law in many jurisdictions.
System integration
Traffic data in isolation tells you how many people showed up. Connected to your POS, it tells you conversion rates and revenue per visitor. Connected to your CRM, it reveals whether high-value customers behave differently in-store than new prospects. Connected to your workforce management system, it auto-generates staffing recommendations. The integration layer is where the value multiplies.
Consistency across store formats
Corporate-owned flagships, franchise locations, mall kiosks, shop-in-shop formats inside electronics retailers—telecom networks span wildly different physical environments. Your measurement standards need to work across all of them with consistent accuracy so that performance comparisons are apples-to-apples, not artifacts of different sensor configurations.
Real-time dashboards and alerts
A weekly PDF report doesn't help a store manager dealing with a Thursday afternoon queue crisis. Real-time dashboards at both HQ and store level—with threshold alerts for metrics like queue time exceeding 10 minutes or conversion dropping below a set floor—turn data into immediate action.
Future Evolution of Telecom Store Analytics
Foot traffic analytics is evolving from "how many people came in" to "what should we do about it before they arrive."
Predictive staffing and inventory positioning: Machine learning models trained on historical traffic, weather, marketing calendars, and device launch schedules will forecast visitor volume by hour—letting managers staff proactively rather than reactively.
Zone-level journey mapping: Instead of door counts, analytics will trace the full customer path: device exploration → queue → associate consultation → accessory upsell → payment. Each transition point becomes an optimization target.
Appointment system integration: As telecom retailers blend walk-in traffic with scheduled consultations, analytics platforms will balance both streams. They'll predict wait times and optimize the ratio of appointment slots to walk-in capacity.
Cross-channel attribution: The holy grail for marketing teams. Connecting digital ad exposure, email campaigns, and social media interactions to actual physical store visits and purchases. Geo-location data matched with campaign timing makes this increasingly possible without individual-level tracking.
Telecom retail is moving toward a model where every store operates with the same behavioral visibility that e-commerce teams have enjoyed for years. The technology exists today. The question for each retailer is whether they'll adopt it now—while it still offers competitive advantage—or later, when it's simply the cost of doing business.
Sources
- Korem — Overview of traffic data applications and ground-truth measurement in retail
- MRI Software — Guide to tracking and using traffic data including Wi-Fi, Bluetooth, and video analytics
- Pygmalios Insights — In-store analytics market projections, ROI benchmarks, and technology accuracy data
- Luth Research — Methodology for retail traffic benchmarking and permission-based tracking
- Placer.ai — Retail location analytics including visit trends, trade-area insights, and competitive benchmarking
- GrowthFactor — Comparison of traffic analytics providers and typical platform capabilities
- IAB DOOH & In-Store Retail Media Playbook 2024 — Sensor and Wi-Fi analytics for in-store consumer behavior measurement